THREE DIMENSIONAL DATA PRESENTATIONS
Authors:
Andrej Mrvar
University of Ljubljana, Faculty of Social Sciences
Kardeljeva pl. 5, 1000 Ljubljana
e-mail: Andrej.Mrvar@uni-lj.si
WWW: http://www.uni-lj.si/~fdmrvar/andrej.html
Vladimir Batagelj
University of Ljubljana, Faculty of mathematics and physics
Department of Mathematics, Jadranska 19, 1000 Ljubljana
Tel: 386 (61) 1766 672; fax: 386 (61) 217 281
e-mail: Vladimir.Batagelj@uni-lj.si
WWW: http://vlado.fmf.uni-lj.si/
Presented at DSI'96, Portoro"z, April 1996.
ABSTRACT
VRML (Virtual Reality Modeling Language) and freely available browsers for
it enable three dimensional presentations to become very popular also on
personal computers.
We can use VRML to describe 3D objects in space, for example multivariate data in data
analysis, 3D graphs in mathematical graphics and chemistry, planets in astronomy...
Several VRML elements can be used in a presentation of multivariate data:
position (x, y, z), color, size, shape (sphere, cube, cone, cylinder,
plane, ...), pattern (texture), direction, text.
Beside these we can include some other effects, for example lights (light
sources, shadowing, transparency, reflections,...).
One of the most important features of VRML is the possibility of moving in
the obtained space (called scene). This possibility is something special if
we compare it to the classical graphical presentations.
In the paper we present some examples of 3D presentations of multivariate
data.
1. INTRODUCTION
Some experts for virtual reality formed a group on the first Web Conference in May 1994.
This group should prepare some additions to HTML (HyperText Markup
Language) in the field of virtual reality. So the idea of VRML
(Virtual Reality Markup Language) was born.
Silicon Graphics supported that ideas significantly
giving in free use its language for description of three dimensional objects
Open Inventor [3] together with its parser.
On the next conference, in October 1994 in Chicago, first version of VRML was announced.
Designers decided, that HTML and VRML should be "orthogonal" but connected languages
- VRML became Virtual Reality Modeling Language.
In May 1995 first shareware VRML browser WebSpace appeared.
In August 1995 Paper company gave the browser WebFX
in free use. WebFX is plugin for Netscape
- the most popular HTML browser. WebFX was later renamed to live3D.
After that VRML was used in many areas: data organization, three dimensional “maps”,
modeling, mathematics, chemistry, medicine... Especially a lot was done in chemistry
(look for example
http://ws05.pc.chemie.th-darmstadt.de/vrmlG/
in Darmstadt).
2. THREE DIMENSIONAL DATA PRESENTATIONS
In a presentation of multivariate data we can use several VRML elements:
- position in space (x, y, z),
- shape (sphere, cube, cone, cylinder, plane, ...),
- color,
- size,
- pattern (texture),
- direction (orientation),
- text,
- lights (different light sources, shadowing, transparency, reflections, ...),
- rotation of objects,
- different views and moving in the obtained scene.
3. EXAMPLES
27 different types of food
were compared using 5 variables:
- Food Energy,
- Protein,
- Fat,
- Calcium,
- Iron.
Variables were standardized before use.
3.1 Example 1. Planets I.
The simplest presentation of multivariate data is a presentation
using planets: three selected variables are shown using positions in the space.
Example 1.
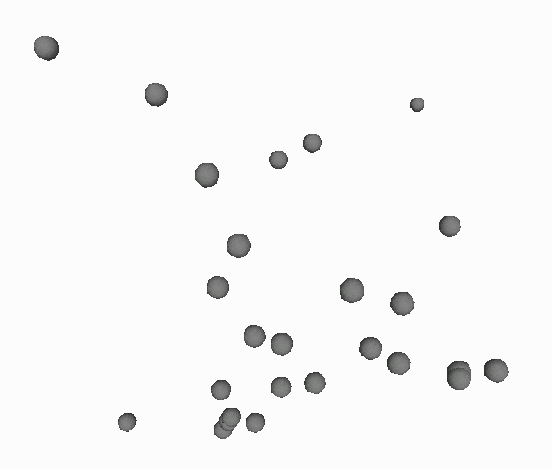
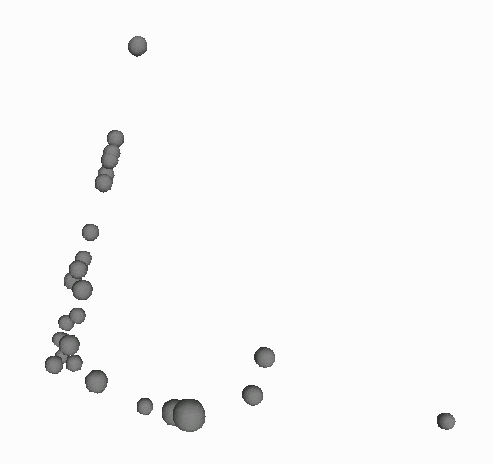 In the picture variables Protein, Fat and Calcium are shown.
Different views show interesting dependencies in data.
3.2 Example 2. Planets II.
Let show three other variables: Food Energy, Protein and Fat.
Example 2.
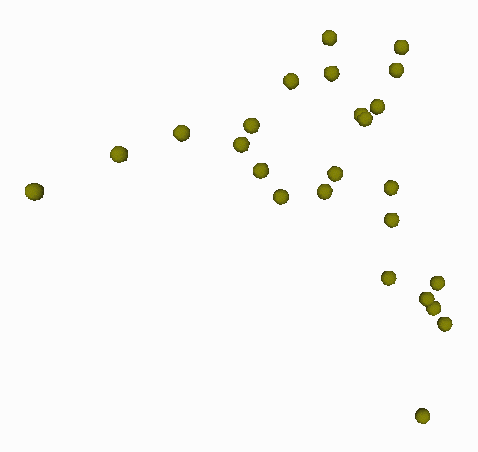
 The view with the highest variance was selected in the left picture.
In the right picture we can notice that data is two dimensional in fact.
3.3 Example 3. Planets III.
Additional information can be expressed using color, size and shape
of objects that represent units.
Example 3.
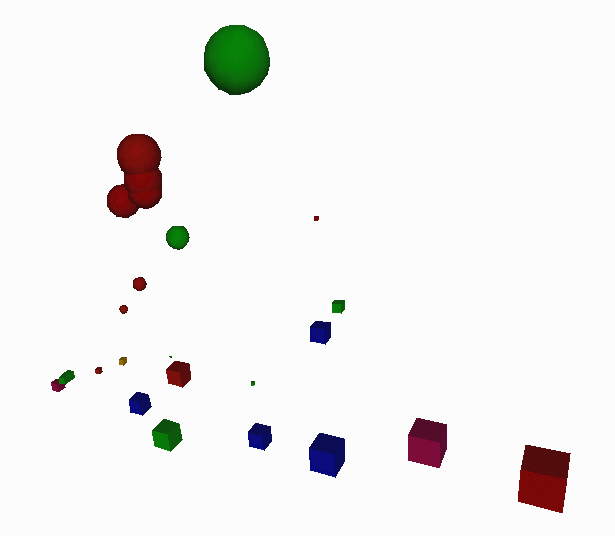
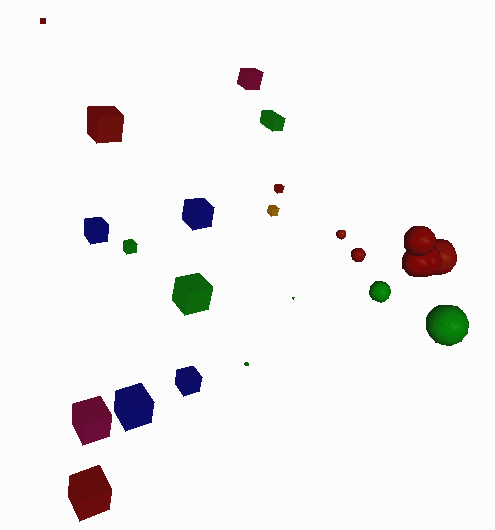 Groups of similar types of food can be easily noticed in both pictures.
3.4 Example 4. Stars
The use of stars is the alternative possibility for describing multivariate data.
Three variables are presented using position in the space, all variables are
presented using the lengths of the rays of the star. We can also use different
colors for different rays.
Example 4.

 Principal components is often used data analysis method. Till
now only two components have been used in data presentations (mostly).
In this example position in space presents first three principal
components. If we look at the example we can see, that the shapes
of the stars explain their positions in space (or vice versa)
- stars that are closer are more similar than the others.
3.5 Example 5. 3D Histograms
We can express many variables using 3D histograms.
Example 5.
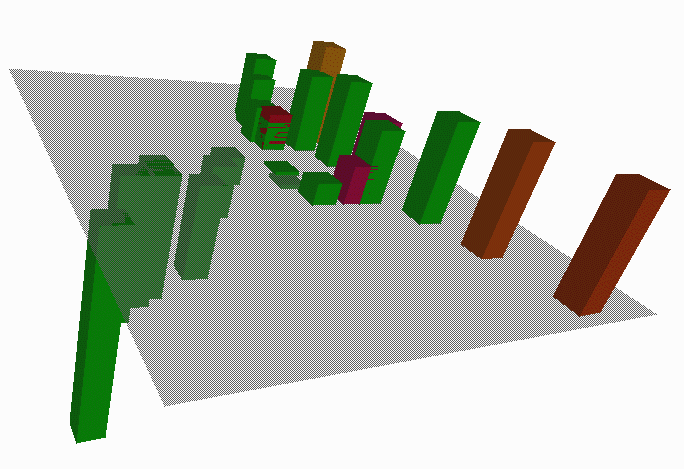
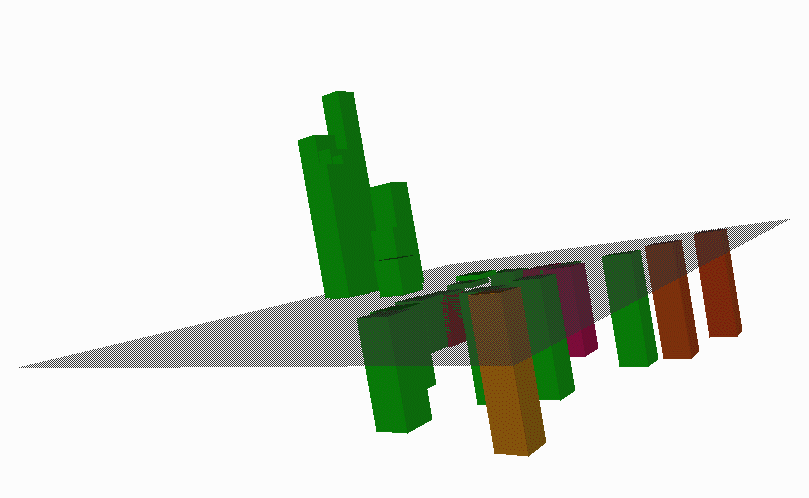 Two variables determine the place in the plane, the third determines the height of corresponding column,
the fourth its color.
3.6 Example 6. 3D Dendrograms
Hierarchical clustering is also often used data analysis method. The process of joining can
be shown using dendrograms. We can combine this process to principal components again.
First two principal components determine the position of unit in the plane.
Units are then joined using 3D dendrograms according to hierarchical clustering
algorithm.
Example 6.
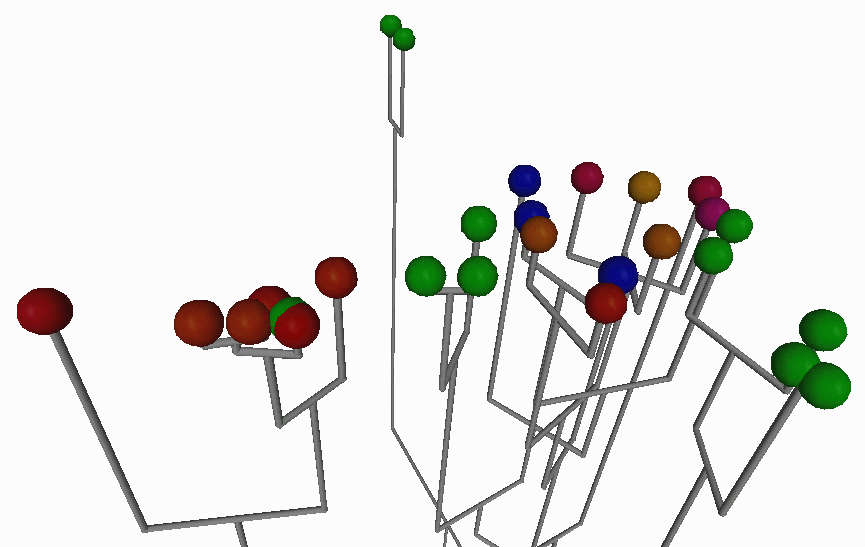
 In this way we can again found some similarities between both methods:
units that are closer (according to principal components) are joined
earlier than the others.
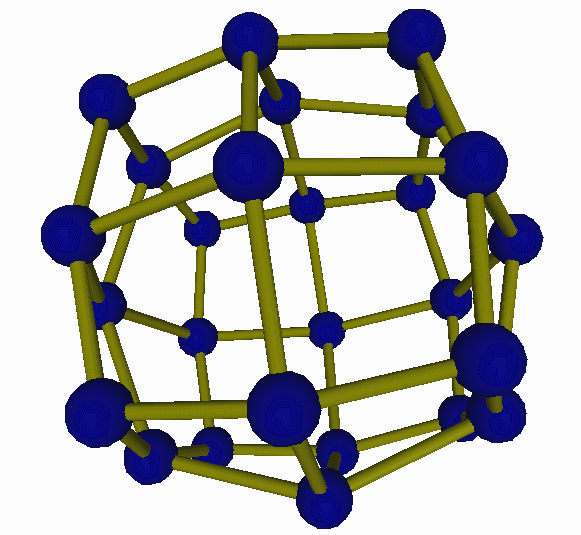
3.7 Example 7. Molecule and graphs
3D presentations are often used in chemistry and mathematics too.
Example 7.

REFERENCES
- A. L. Ames, D.R. Nadeau, J.L. Moreland: The VRML Sourcebook.
John Wiley & Sons, Inc., 1996.
- G. Bell, A. Parisi, M. Pesce: The Virtual Reality Modeling Language.
Version 1.0 Specification.
http://www.sdsc.edu/SDSC/Partners/vrml/Archives/vrml10-3.html
- J. Warnecke: The Inventor Mentor.
Addison-Wesley Publishing Company, 1994.
- F. W. Young, T. Edds, D. Kent, W. F. Kuhfeld:
Visual Exploratory Data Analysis.
In: Classification as a Tool of Research, Proceedings of the 9th
Annual Meeting of the Classification Society (F.R.G),
University of Karlsruhe, F.R.G., 26-28 June, 1985.
edited by W. Gaul and M. Schader.


