Lothar Krempel, Max Planck Institute for the Study of Societies, Cologne,
Germany
Summer Joker: Time Geography of Visiting Behavior
Event Sequences and time intervals between places:
-
There are different ways to extract temporal distances from
the individual event sequences
-
the time between consecutive events
E1 E2
E3 E4
d12 +--------+
d23
+-------+
d34
+---------+
-
we also can add the temporal distances between non-consecutive
events
E1 E2
E3 E4
d13 +--------------------+
d14 +--------------------------------+
d24
+--------------------+
-
both result in different distributions of
temporal distances between pairs of events
-
using the differences between non-consecutive events adds
additional information about the choices between potential alternatives
-
a simple way to characterize these distributions is to use
their means to describe the transitions between different places
-
is the resulting matrix of mean time differences symmetric
? (what could that mean ??) otherwise symmetrize
Analysis
-
We propose to analyze the temporal distances in relation
to geographic space
-
we use the geographical coordinates of the places for the
layout the nodes of the graph
-
for any place we additionally have a vector of mean
time differences to all places
-
a vector of arbitrary time-thresholds can now be used to
determine the sets of all places that can be reached from a given source
in a given time intervall.
-
this results in a number of sets
-
each of these sets contains all places that have been visited
from this place in a given time intervall
-
sets for smaller time threshholds are subsets of places of
those for larger time-intervalls
-
using the geographical coordinates of the places in each
set allows to compute their convex hulls. These describe the area in geographic
space that has been accessed from a start point in a given time.
-
Repeating the analysis for several places allows to study
the intersection of places that are reached from different places in similar
times.
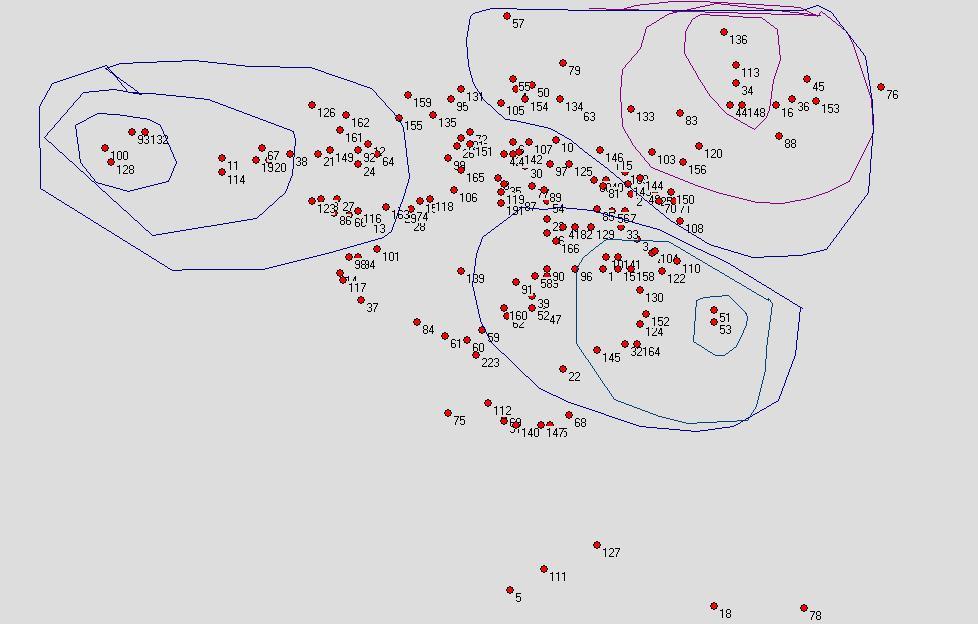
A Sketch of a potential Solution
-
Three locations (100, 113, 51) have been chosen as start
points of the analysis
-
Three convex hulls show for each of the places the geographical
domains (the set of nodes) that have been visited in the next five hours,
the next day .. the next two days