Example: Slovenian magazines and journalsOver 100.000 people have been asked which magazines and journals they read (survey conducted in 1999 and 2000, source CATI Center Ljubljana). They listed 124 different magazines and journals. The collected data can be represented as 2-mode network:
                 Delo    Dnevnik   Sl.novice ...
Reader1            X                   X     ...
Reader2                     X                ...
Reader3            X                         ...
............     .....   .......   ......... ...
Obtaining 1-mode networkFrom 2-mode network reader/journal we generated ordinary network, where the vertices are journals
                 Delo    Dnevnik   Sl.novice ...
Delo            20714       3219        4214 ...
Dnevnik                    15992        3642 ...
Sl. novice                             31997 ...
........        ......     .....       ..... ...
The second ordinary network on readers would be huge (more than 100.000 vertices)
containing large cliques (readers of particular journal).
Data analysisBecause of the huge differences in number of readers of different journals it is very hard to make any conclusions about journals connectivity according to raw data. First we have to normalize network. There exist several types of normalizations: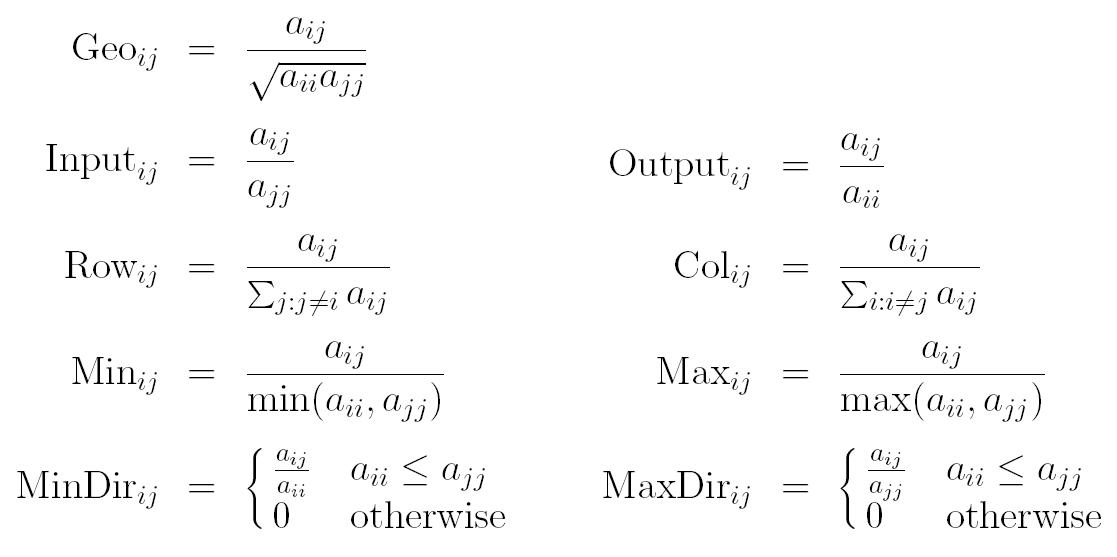
Geo normalizationUsing Geo normalization we divide elements of the matrix by geometric mean of both diagonal elements. In our case this normalization is a measure for connectivity (corelation) among journals.MinDir normalizationMinDir normalization makes two things:
|