Graph C
This is a new idea of Joe Marks and Sue Whitesides.
Background and Task
Interactive Graph Analysis
In previous graph-drawing contests the emphasis has been on the production of graph drawings
that could be used to support a variety of unspecified visualization or analysis tasks. In this part of
the contest we make the analysis tasks explicit and require contestants to conduct interactive graph
analysis in real time. We hope that as in years past, this contest task will inspire new research into
graph-drawing and graph-analysis methods! Two graphs will be used for this part of the contest.
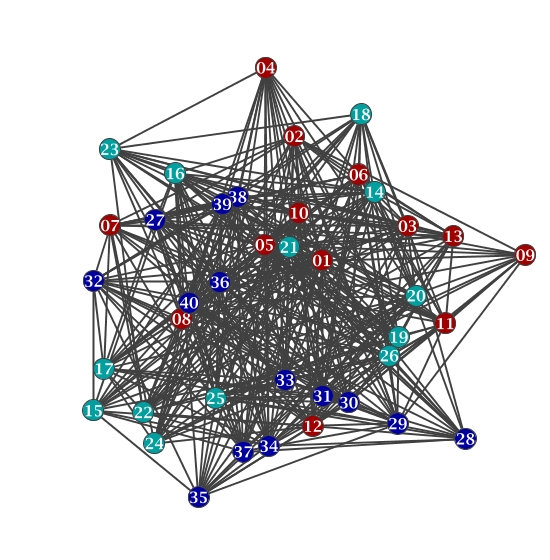
Graph A is a random graph G(n1, p1), where n1 = 40 and p1 = », i.e., Graph A has 40 nodes and
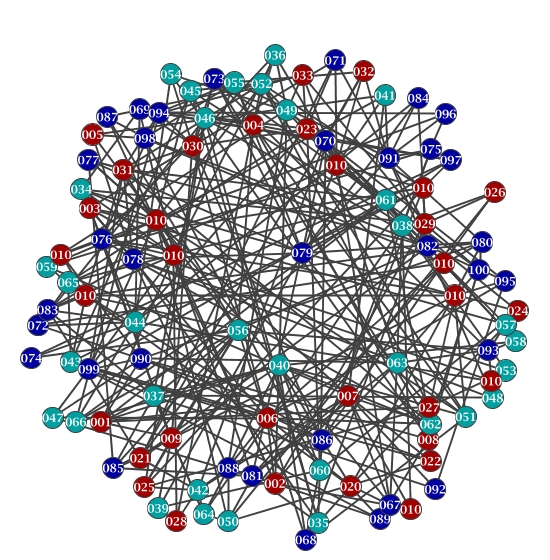
the probability of an edge existing between any two nodes is 0.5. Graph B is larger and
sparser: B = G(n2, p2), where n2 = 100 and p2 = (3 + ln(100))/100 = 0.07605. The nodes in each
graph are numbered from 1 up to n. Furthermore, the nodes in each graph are colored
either red, green, or blue with equal probability. Both graphs are available via the links below.
The goal for this part of the contest is to answer questions about the two graphs in real time.
Here are two sample questions to illustrate the kinds of questions that will be asked:
-
What is the largest monochromatic wheel subgraph in Graph A? (A wheel graph of n nodes consists of a
cycle on n - 1 nodes together with a hub that is attached to each node of the cycle. A monochromatic wheel
graph may not have any additional internal edges, but it may have nodes adjacent to nodes of other colors.)
-
In Graph B which two nodes are connected by the largest number of disjoint, trichromatic paths?
(A trichromatic path is one that contains at least one node of each color.)
The answers to all questions will be sets or ordered lists of nodes. Contestants can organize themselves
in teams of up to three people. Each team can use any hardware, software, or drawings to aid them in
answering the questions. The winning team will be the one that provides the best answers in real time
to six questions.
Questions regarding this contest should be sent to Joe Marks
() and Sue Whitesides
(sue@cs.mcgill.ca)
Data
The two graphs are available below in a variety of formats.
Graph A. [g40.csv, g40.gml, g40.gw,
g40.svg, g40.jpg]
Nodes 1-13 are RED.
Nodes 14-26 are GREEN.
Nodes 27-40 are BLUE.
Graph B. [g100.csv, g100.gml, g100.gw,
g100.svg, g100.jpg]
Nodes 1-33 are RED.
Nodes 34-66 are GREEN.
Nodes 67-100 are BLUE.